

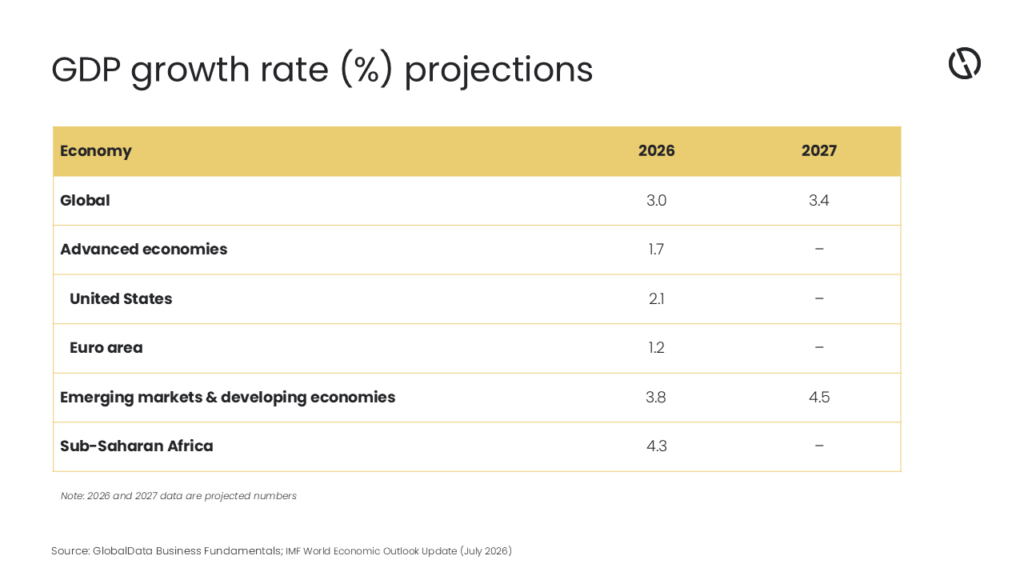
Global growth is projected at 3.0% in 2026, which is expected to rise further to 3.4% in 2027, broadly unchanged from forecasts issued six months earlier. While stability is expected to persist, sharp differences between individual economies remain. Growth outcomes in 2026 increasingly depend on two factors: exposure to war-related energy costs and a position within the artificial intelligence (AI) hardware value chain, according to GlobalData, a leading intelligence and productivity platform.
The top four net exporters (Thailand, Malaysia, Taiwan (Province of China) and South Korea) of AI hardware recorded a growth surprise of 4.4 percentage points above forecast in the first quarter of 2026, compared with a negative 0.3 percentage points for the rest of the world.
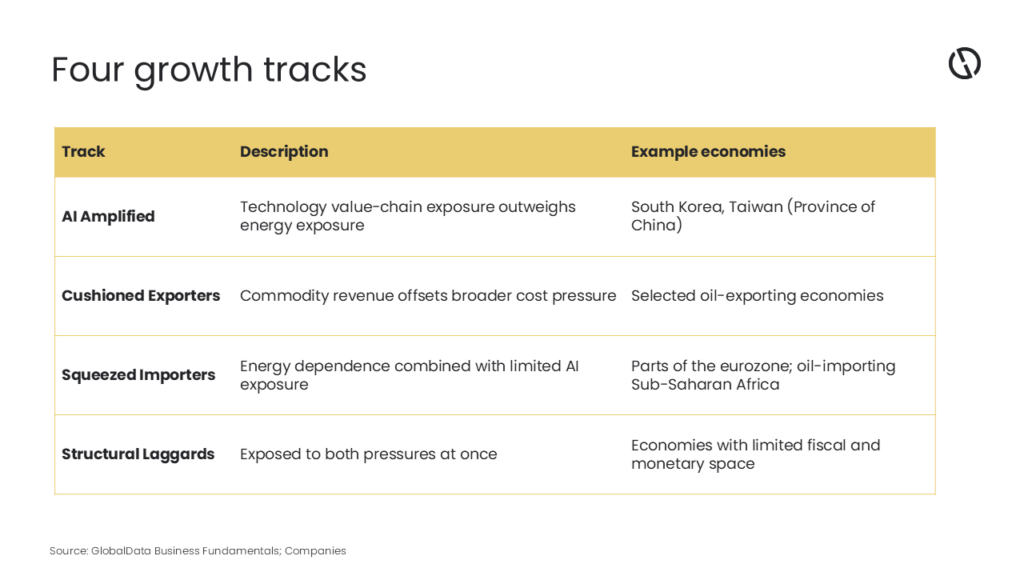
Ramnivas Mundada, Director of Economic Research and Companies at GlobalData, comments: “South Korea imports almost all its energy, yet its position in the AI hardware supply chain is offsetting that exposure. Growth outcomes in 2026 are following a different pattern from the traditional split between energy importers and exporters.”
Why old map explains less
Regional and income-based categories, such as advanced versus emerging economies, describe less of the current divergence than in previous years. Sub-Saharan Africa illustrates this within a single region: aggregate growth is projected at 4.3% in 2026, a figure that combines materially different conditions for the region’s oil exporters and its oil-importing economies.
Growth linked to AI hardware is not limited to chip producers. Countries involved in data center construction and component assembly are also part of the pattern, particularly across East and Southeast Asia.
Investment and strategy teams are increasingly assessing country exposure along both dimensions, energy cost and technology-value-chain position, rather than by region or income group alone.
The divergence also extends to monetary policy. Cushioned exporters have generally faced less inflationary pass-through from higher energy costs than squeezed importers, pointing to different interest rate paths across the two groups over the coming year.
Mundada concludes: “The headline global growth figure describes very little about individual economies this year. Two factors, energy exposure and technology-value-chain position, explain much more of the difference.”